|
Ticki TradingWhat is the ticki and why is there a concept of ticki trading? The Dow has 32 component stocks. If at certain point in time the ask was last hit for all 32 components, we have a ticki value of 32. If at another moment the bid's of the 32 components is hit, we have a ticki value of -32. Most times however the ticki probably trades between +- say 20.
Ticki extremes >+- say 22, probably does not occur by coincidence. A plausible explanation perhaps is that a Institutional program trade occurred. An Institutional trader just bought a majority of Dow stocks (in the case of a ticki high) and simultaneously sold the futures contract.
Perhaps the Institutional investor thought that the difference (premium) was too large an entered an arbitrage trade. If the futures contract is in congestion, it may imply that prices are going to backoff the high of a range. Ticki then becomes like a overbought/oversold indicator. This is powerful information for a scalper.
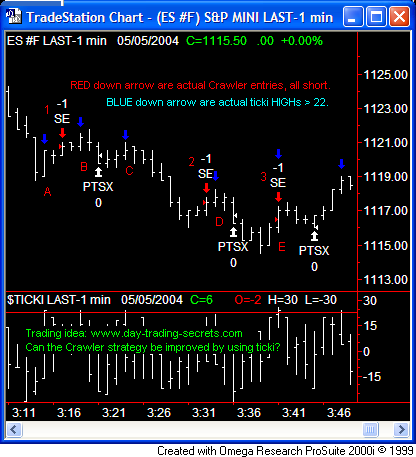
Based on the fascinating chart below, I have taken a different approach, to improve Crawler. A day trading scalping trend follower like CRAWLER, would handle the situation differently. Examine the following 1 minute chart of the ES. The red down arrow bars marked SE -1, marks a short entry by Crawler. Each SE bar is marked by a red 1, 2 and 3. The ticki high bars are marked with a blue down arrow. Note how the blue arrow marked, ticki high bars, seem to confirm the retracement in a trend, very well. While Crawler performance is quite acceptable, my next direction of research is using ticki information to augment the basic Crawler algorithms.

|